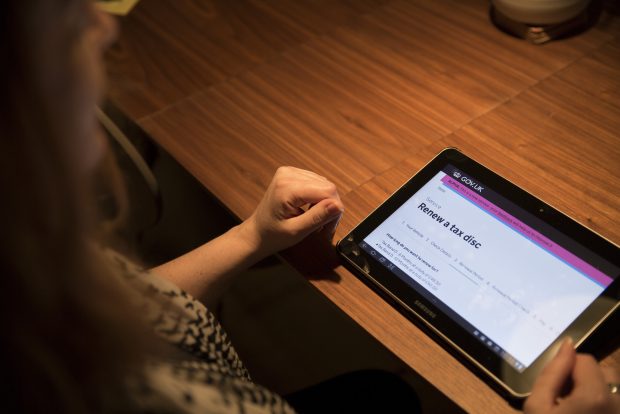
In 2013, I co-created the Digital Inclusion scale - a 9-point scale measuring digital capability- as part of the then government’s Digital Transformation Programme and the Digital Inclusion Strategy.
Created alongside Jon Rimmer, the intention of the scale was to help service teams see the breadth of diversity in their users and appreciate the range of digital skills and capability users had. It was also intended to identify potential opportunities to help people use government services
Six years on, the scale has become one of government’s most ubiquitous tools used to highlight people’s digital capability and has:
- been used as a visual user research asset in hundreds of service assessments
- helped teams to make participant recruitment more inclusive
- been a source of inspiration for numerous blog posts
- been adapted to visualise data literacy in government
Why 9 points and not 10?
It was developed using evidence from GDS’s digital landscape research, data from the BBC and data from the Office of National Statistics (ONS).
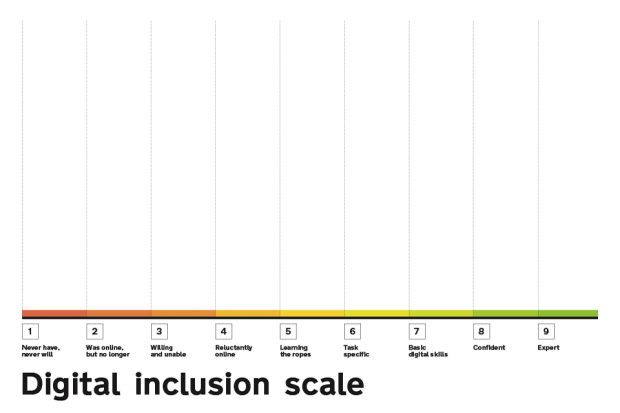
There were 10 points on the scale when it was first drafted but after point 9 anything beyond felt meaningless and unrepresentative of the 20% of the UK population who lacked basic digital skills.
Each point on the scale highlights the range of digital capability from those who had consciously decided not to use the internet and therefore had never been online and never would, to experts whose primary income came from using online services.
Basic digital skills, as defined by digital organisation GO On UK - which has since become doteveryone - was deemed to be the minimum capability that people needed to have in order to use the internet effectively.
How we developed the inclusion scale
In the early days, we did not really know who would use the scale or how it would be used, especially in the context of designing government services. It was a case of trial and error when testing out the feasibility of the scale.
At first, the idea was simply to use the scale as a way to assess the potential digital capability needed to complete certain government transactions. We focused on testing out the scale with teams working on the 25 ‘digital by default’ exemplar services.
We asked service owners to review their services, identifying the things people needed to do to achieve a successful outcome. We asked them to consider:
- the levels of complexity involved
- the potential time that would be needed to get something done
- whether more than one person needed to be involved in completing the task in hand
It did not take long to realise 20% of the UK population would struggle to use some of the exemplar services because they lacked basic digital skills.
Back to the drawing board
After testing the scale with service managers, we quickly learned that others would benefit from using it if we provided some simple instructions on how to use it.
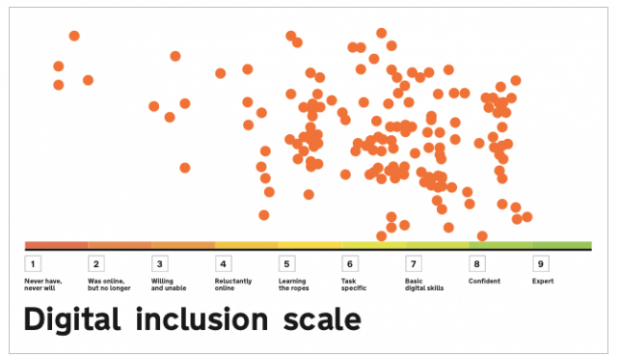
So, we asked user researchers working on the exemplar services to plot onto the scale the observed digital behaviour of the participants that they saw in their research sessions.
To avoid under and over estimated capability, we specifically requested they did not plot the digital skills the participants said they had, but focus on what the users did.
Being able to physically plot and visually highlight the gaps in user group representation raised interesting questions as to how the scale could be used to help teams be more inclusive in their recruitment activities.
What we learned about scaling the scale
As the usefulness of the scale became apparent and the appetite to use it increased, so did the need to iterate and provide firmer guidelines.
The benefits of the scale were easy to see. Teams could:
- quickly see the breadth of digital capability people had, against the skills required to use the service
- easily see gaps in their recruitment and use that to help refocus their recruitment efforts
- talk confidently about research, recruitment and users in service assessments
- have evidence-based conversations around potential options for assisted digital support
However, several factors have impacted on the ability to update and improve the scale.
For instance, with no defined axis criteria it lacks the ability to capture the nuances of attitudinal behaviour, accessibility, emotion, literacy and access to technology. And as the scale did not "belong" to a specific team, further iterations have been limited.
But currently there are no plans to develop the scale. Its simplicity has perhaps ensured its longevity, at least for now.
It’s encouraging to see it’s still being used in a variety of different ways and I’m very proud to have worked on it.
Have you used or adapted the scale? Do you have any insight to share? We’d love to hear from you!
Recent Comments