A/B testing is a quantitative user research method that helps us understand user behaviour in a real-life context. We use A/B testing at HMRC to help teams know if the changes they make to services are solving the problem as intended.
We can do A/B testing on services that are in the beta or live stage, as well as on our mobile apps and internal services. And we do other types of experiments too, like multivariate testing and trials of new features with small audiences.
Quantitative experiments are most effective in beta and live because larger numbers of users are needed to detect the effect of smaller design iterations.
Understanding the effect of design changes
Let's say you’ve implemented a change in a service because it has already tested well with users in previous user research. Over the next couple of weeks you see an improvement to your service click-through rate or customer satisfaction.
But how much of this improvement was due to the design change? Would the click-through rate have increased anyway because of other external factors that may have affected user behaviour, like deadlines or the time of year?
Using A/B testing to split users into two randomised groups can show how much of the service improvement, if any, was due to the design iteration. One group sees the original page (the control) while another group sees the redesigned version (the variant). This way they can be compared fairly.
In a scenario where more than one design performs well in usability testing, running an A/B/C test can help identify which design should be implemented in the live service.
Writing a hypothesis based on evidence
A valid hypothesis is the basis of every A/B test. These hypotheses generally follow a 3 part format, shown below:
We believe that … [the problem]
So if we … [the proposed design solution]
We will see … [the primary measure of success]
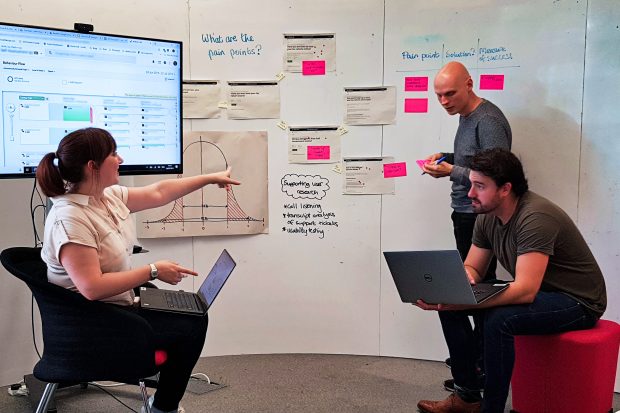
Evidence from user research and analytics helps us understand the first part, the problem to be solved. For example, during usability testing we found that some tax credits users using a mobile device missed a grey button that let them check their upcoming payments. Evidence from analytics revealed that only 66% of mobile users clicked the grey button. We also had insight from the call centres which showed users were contacting the helpline to check their payments. In this situation, our hypothesis was:
We believe that mobile users do not see the grey button
So if we change the colour of the button
We will see an increase in click-through rate
Measuring success
Understanding the user need helps us define the right measures of success for an A/B test. The primary measure of success tracks a specific user behaviour to show if your hypothesis is proven or disproven.
We have secondary measures of success too. These could include comparing the control and variant’s effect on help link clicks, service completion rate and customer satisfaction score. These help us see the impact of the change on other parts of the page and the rest of the user journey. We want to make sure a positive change in one place does not cause an unintended negative change in another.
We also analyse phone call volumes and user waiting times, and can attribute these to the control or variant design.
One of our A/B tests involved adding webchat to a service to understand uptake as part of wider research on HMRC’s support model. We were able to show the most optimal pages to add webchat. For one of our target pages we saw the following changes:
- the customer satisfaction score improved by 6%
- support ticket submissions reduced by 43%
- the number of phone calls received went down by 12%
Learning from failure
We could do an A/B test and find the new design performs worse than the control. This is not a failed experiment. We have learnt what does not work for our users and can use this insight to inform our next A/B test.
We can also learn by trialling new features with a small number of users first. Recently we used our A/B testing tool to send only a small percentage of users to a private beta release of the employment expenses tax relief service. The team could learn and iterate with small user volumes, reducing risks and allowing them to fail fast and learn quickly.
Designing A/B tests as a team
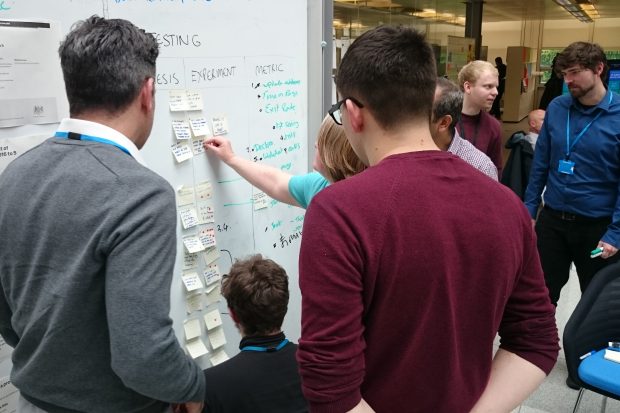
At HMRC, we believe A/B testing, like all user research, is a team sport. Hypotheses are designed and prioritised with the whole scrum team at workshops, usually ran by a user researcher or performance analyst.
At a hypothesis generation workshop, screenshots of the service are printed off to create a journey map on a whiteboard. Participants use data and insights to write known pain points on sticky notes so they are visible to the whole team. The team can then discuss design solutions to solve these pain points and then map these to measures of success.
These workshops also prompt interesting conversations about future usability testing, improvements to analytics tagging and bug fixes for the backlog.
Our ‘centre of excellence’ approach
At HMRC we have a small, central team of experts from different backgrounds who innovate in experimentation and upskill scrum teams so they can run their own A/B tests.
Our digital experimentation ‘centre of excellence’ is responsible for:
- iterating the A/B testing workflow
- onboarding and training teams
- ensuring experiments are robust
- checking if results are statistically significant
- iterating technical guidance for frontend developers
- evaluating how experiments are creating operational efficiencies and driving down costs
Over the last 2 years we have iterated and matured in our use of A/B testing. Now we want to embed a culture of experimentation at HMRC.
If you have an idea for a blog post, let us know in the comments section.
3 comments
Comment by Nikaesh Rattan posted on
The hypothesis generation work shop allowed me to really implement the changes, it allows the screenshots of the service to be printed off to create a journey map on a whiteboard. Participants use data and insights to write known pain points on sticky notes so they are visible to the whole team. The team was able to then discuss design solutions to solve these pain points and then map these to measures of success.
It's great way to condense the ideas in sticky note format and can be used in all arenas.
Keep up the great and innovative work.
Comment by Bonnie Brown posted on
Great post Jennifer 🙂
Comment by Rob Harvey posted on
Hi Jennifer,
The Armed Forces Recruiting Programme (AFRP) would be very interested to discuss HMRC approach to the testing environment.
Email: robin.harvey117@mod.gov.uk