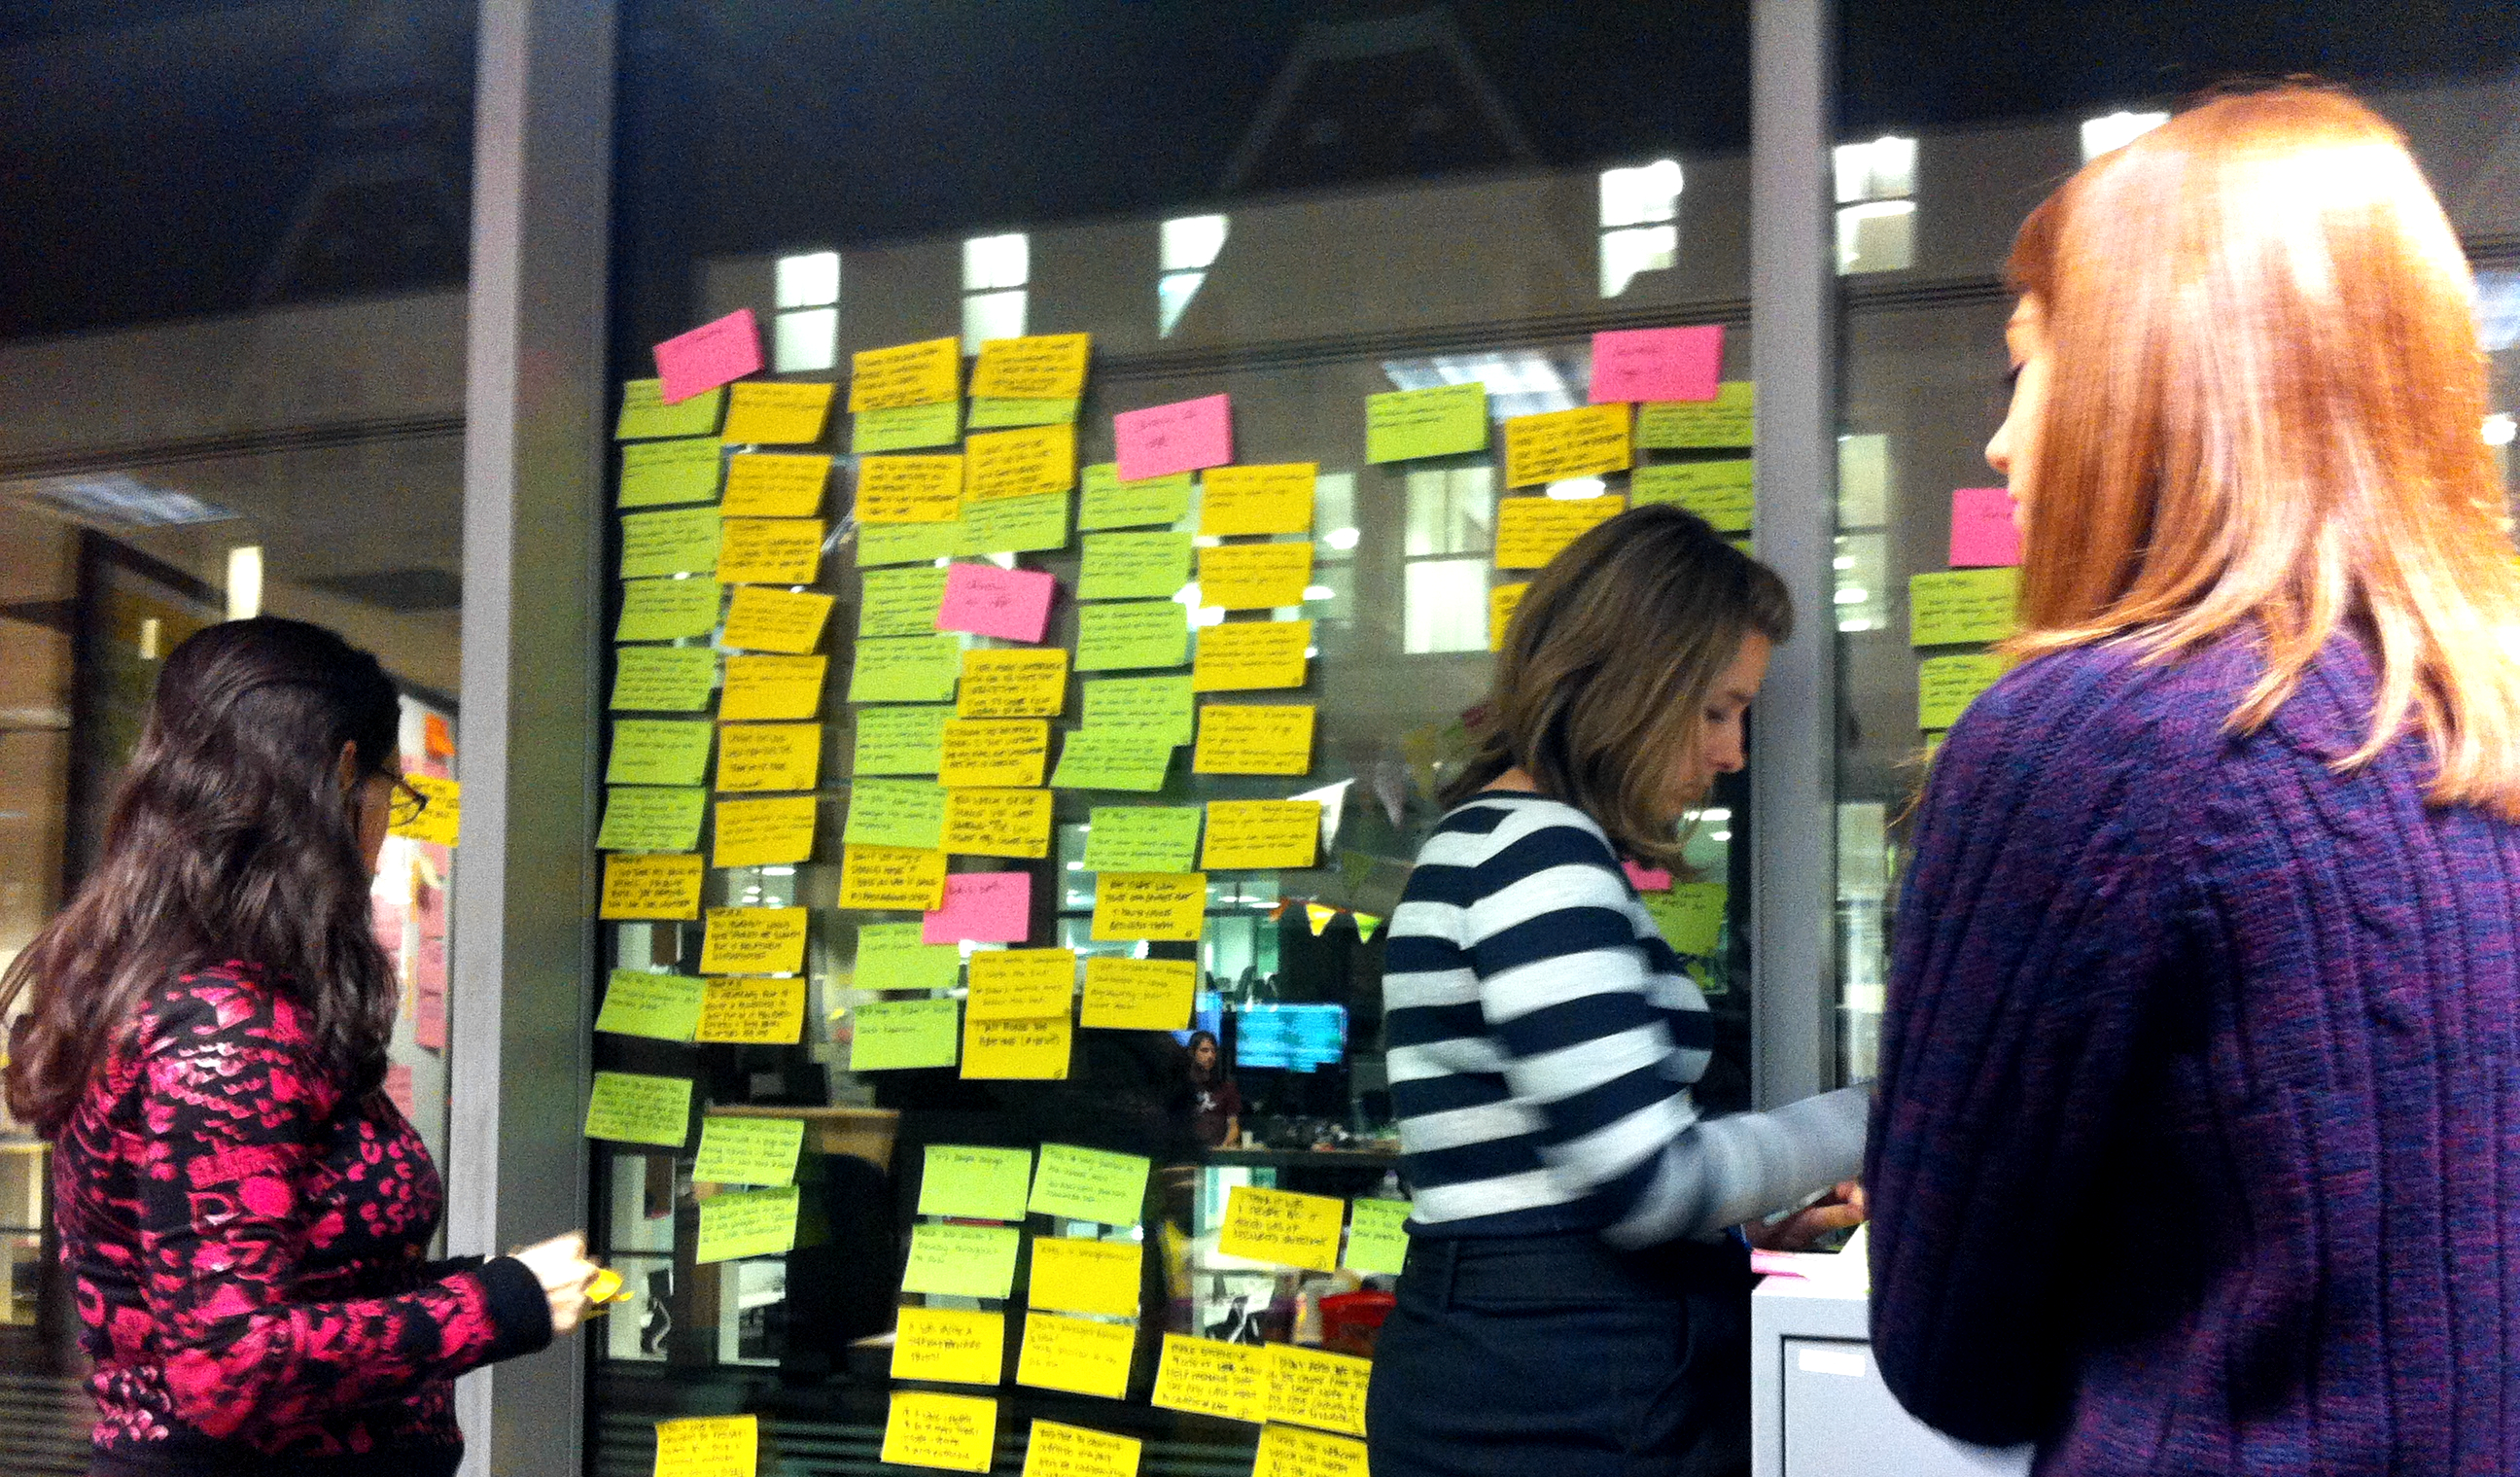
At a recent all staff meeting, a guest speaker joked that GDS must be keeping the sticky note industry in business. It’s true to say, if you visit GDS, you're sure to see a wall covered with sticky notes somewhere.
So what's our love of sticky notes all about?
One of the many reasons we're so fond of sticky notes is that they play a big part in how we analyse research in an agile team. Sticky notes help us do analysis that is rapid, collaborative and highly visible.
Here's how we do it.
During the research session
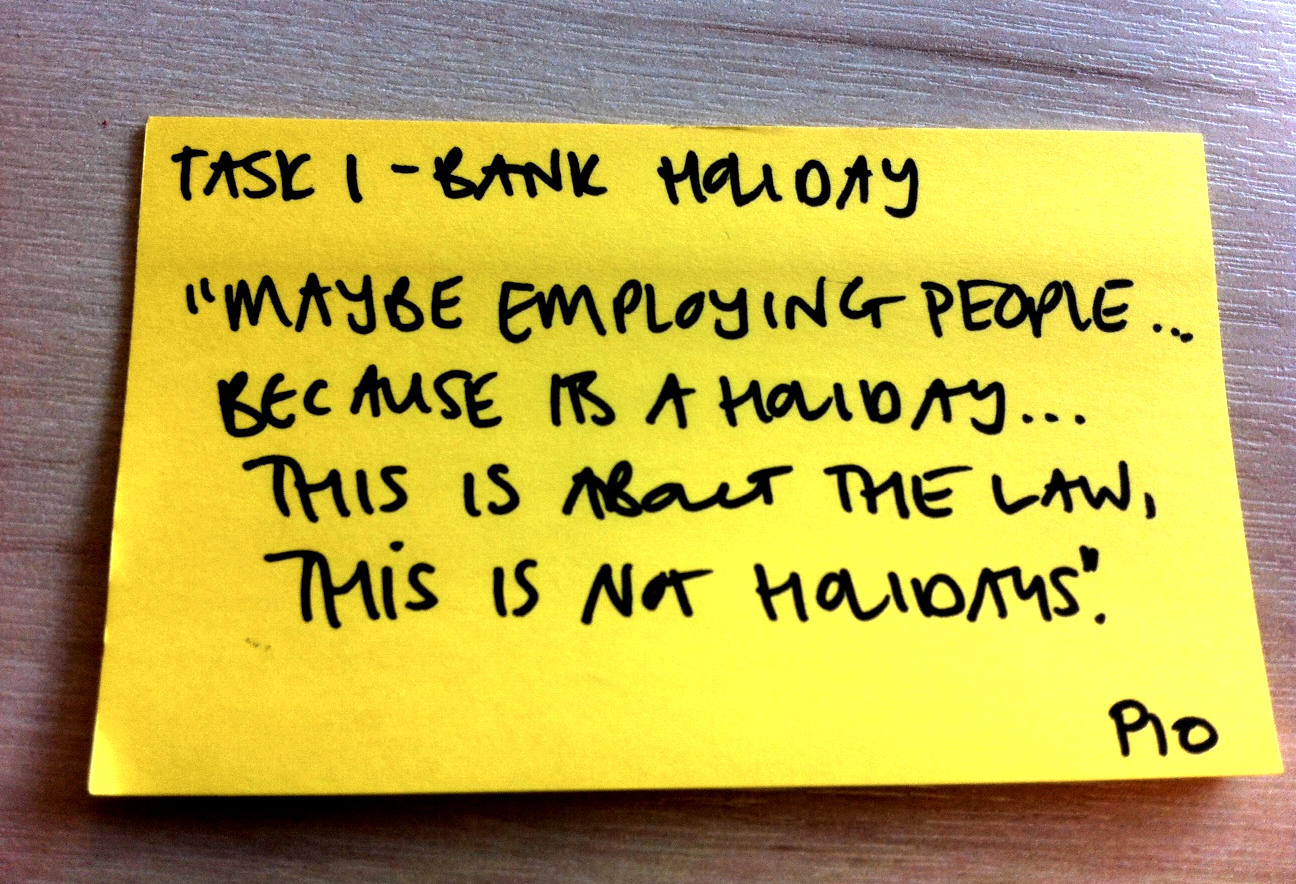
During the research session, we write verbatim quotes and user activity on sticky notes.
If you’re doing research in a lab, ask someone observing to write sticky notes for you. If you're out in the field and researching alone, you might make these notes afterwards from your audio or video recordings.
- Write an observation on a sticky note whenever a participant says or does something interesting or relevant.
- Make 1 note per observation.
- Give each participant a name or code so you can easily mark each of their notes. This will allow you to track who said what. We most often use a simple code like 'P1' for 'participant 1'.
- Write exactly what you hear or see, not what you think it means. It's important to capture raw data (rather than your own interpretation of it) so that you don't unwittingly bias your findings.
- Use one colour of sticky note for all observation notes. This is useful when you come to affinity sorting.
Sticky notes are perfect for affinity sorting
We use the affinity sorting method to analyse our research. It's a useful technique for sorting through unstructured data and allowing themes to emerge.
- We start by sticking our observation notes on a wall, window or whiteboard - anything large and flat and which the team can stand around will do.
- We then discuss and group our notes based on themes we can see.
- Once we agree on something we’ve learned, we write the insight on a new sticky note (and in a different colour) and add it to the relevant grouping. We call these 'action sticky notes'.
Here Leisa Reichelt, Head of User Research at GDS, shares how she's used affinity sorting to analyse research done on video content.
The unit of analysis is the team
Ideally, do analysis as soon as possible after the research. We try to analyse the following morning.
Everyone who's invested in what we're working on participates and understands what we've learnt. It makes it much easier to decide on what to do next.
User research is a team sport - not only observation but analysis too.
We've found that different people remember different details - encouraging everyone who watched a session to join the analysis helps us gather more information and perspectives.
At the moment on GOV.UK, we're doing a lot of research into design patterns to support browsing behaviour. Our core team for this project is usually a researcher, a designer, a product manager and an information architect. On particular points we might pull someone else from the team into the analysis session, for example, if we're talking about something we've learnt about search, we'll call in our search developer.
Usually everyone who joins in analysis will have observed at least one research session. It's hard to find time when everyone is free but it's really important.
Do something with what you've learnt
The final part of our analysis is agreeing what actions we're going to take. These are written up on sticky notes in a third colour and stuck on the relevant grouping. It’s a handy and visual way to ensure we don't forget to include actions for any of our findings.
Actions might be things we want to change and test in a subsequent round of research. They might be new user stories to add to the product backlog or new details to add to an existing story. Or they might be strategic insights which are used to develop the product roadmap and proposition.
When we're confident enough about our findings to implement them, we might include actions related to analytics - we usually have some hypotheses from the research that we want to measure against afterwards.
And that's how we keep our analysis agile
After the analysis, we share our findings more widely.
At it's simplest, an affinity sort gives a visual map of your findings, which you can photograph and share. It's usually one person's responsibility to write up the outcome and make sure that actions are followed up.
But that's icing on the cake.
The most important part is getting the team around a wall of raw data to thrash out problems and insights from the research. It's how we make sure we're not just gathering insight but actually doing something with it.
Keep in touch. Sign up to email updates from this blog. Follow Cath on Twitter.
1 comment
Comment by Jeff Rankin posted on
Excellent and pragmatic research methodology. Thank you for the article!