User support tickets are how we manage queries while users are interacting with our products and services.
As user researchers, we can often overlook support channels when thinking about users and what we can learn about them.
Support tickets are often sidelined as a business as usual task that our teams just need to get through. And they can be perceived as simply the place where developers respond to bugs or technical issues, with less technical team members left out of the loop.
We believe user researchers should be as close to our user support tickets as our support teams and developers. They are a constant source of feedback and feature requests that, unprompted by us, reveal the issues that are most important to our users.
This helps us to build a picture of how our users think of our products and their mental models for certain issues.
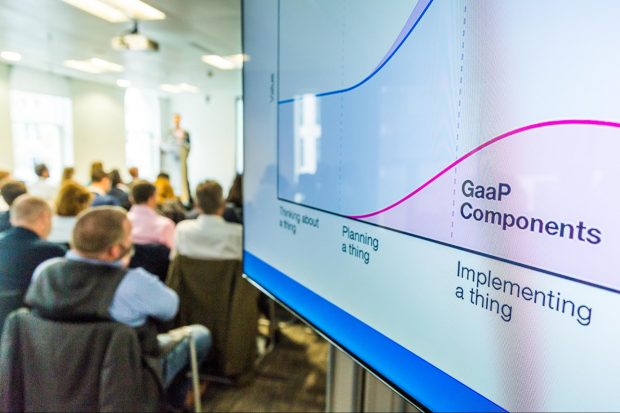
At GDS, we have developed a common way of analysing the support tickets we receive for our Government as a Platform products: GOV.UK Notify, GOV.UK Pay, Registers and GOV.UK Platform as a Service.
Here’s how we have approached this analysis and how we are using these insights to improve our products.
What we did
When we first looked at the support ticket systems across our products we knew there was a huge amount of valuable insight to be gained, but we had no way to manage or analyse it all. And there was no immediate way to see trends or measure things over time.
So we established a common methodology to analyse our support tickets.
Step 1 - Define our objective
To make sure our analysis focused on what was most useful, we initially ran workshops with each product teams to agree the objectives of this research.
In these sessions we printed off a random sample of tickets and gave each team member 5. Everyone was asked to write on Post-its what things they’d want to capture about the ticket, for example the type of request or the date it came in.
We then refined everyone’s Post-its and, by the end of the session, came up with a basic framework for analysis:
Type of request: What kind of issues or questions are people raising?
Date: When do we get most tickets?
Time: How long does it taking us to deal with and solve support tickets?
Action taken: What work are we doing as a result of support tickets?
Organisation: Which departments are raising the most tickets?
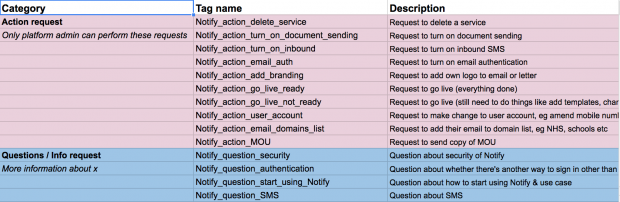
Step 2 - Create a taxonomy
Next, we needed to create a taxonomy so we could start to tag the types of request we were receiving. To do this, we involved a product manager, designer and tech lead who regularly reply to support tickets as part of their roles.
We gave each of them the same 50 tickets and asked them to record how they’d categorise each ticket in a spreadsheet.
We then compared how they had tagged the tickets and refined the categories. We created a final version of the taxonomy and shared it with the whole team.
Step 3 - Tag and analyse tickets
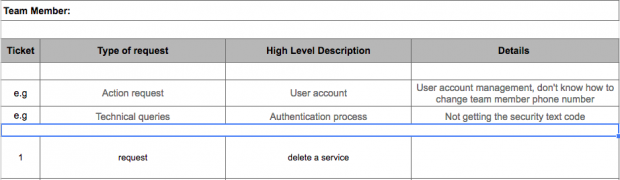
To start analysing support tickets as they came in, we created a spreadsheet to record each ticket received against our taxonomy.
Initially we analysed tickets manually: a user researcher would look through tickets every 2 weeks and enter them into a spreadsheet.
We have since moved away from manually tagging tickets and now create tags in our support ticket system so anyone in the team can assign tags when they reply to them. This means we can run an automated report once a month that gives us high-level figures for the types of tickets we receive.
Step 4 - Share insights with the team
Every 2 to 3 months we create reports that visualise the volumes of tickets and types of request we receive.
From doing this analysis we have been able to identify areas where we get lots of tickets, for example requests to turn on a feature or common questions about a bit of functionality.
In some areas we have been able to implement quick fixes, for example to obvious gaps in our product pages or documentation. In other areas, we have built on the ticket analysis by running usability testing on particular tasks or journeys to get a better idea of what’s going wrong for our users.
Once we have come up with a solution, we’re able to measure whether it is working by tracking the volume of certain types of ticket over time.
Step 5 - Iterating our tagging taxonomies
Our products change all the time - we are always introducing new features or solving problems. This means our taxonomies are always changing too.
It is important to let your team suggest new tags and flag tickets that do not fit within your existing taxonomy. We run retros with our teams to review the usefulness of our findings in order to iterate our tags.
We have found some findings are not actionable or useful to our teams so we’ve cut back on some tags altogether. This helps to reduce the overall number of items in our taxonomy so our research focuses on what matters most.
Embedding support ticket analysis in our research
Support ticket analysis now forms part of our ongoing research into the needs of our users. It is a way of making sure we’re getting unbiased feedback from users that’s not influenced by our product roadmap, discussion guides or questions.
Having a structured way to analyse support tickets has helped us to improve our products and reduce contact from our users.
Follow GDS on Twitter and remember to sign up for blog alerts.
Recent Comments