When building a digital-by-default service like Carer’s Allowance, we’re continuously designing, testing and releasing changes to the live service to improve it and better meet user needs.
But how do we measure whether the changes we’re making are improving the service or not? We conduct user research and analyse service data.
In this post I’ll share how we’ve been approaching this and what we’ve learned.
We're moving away from detailed analytics reports
Analytics reports have their place but they don’t help agile product teams make informed decisions while moving fast. We prioritise and release changes every 2 weeks and need to know quickly how the latest changes are performing.
Key metrics help us measure changes
Key metrics are data points that change over time depending on how well the service is meeting user needs. They relate directly to how easy, quick, or understandable the transaction is for users.
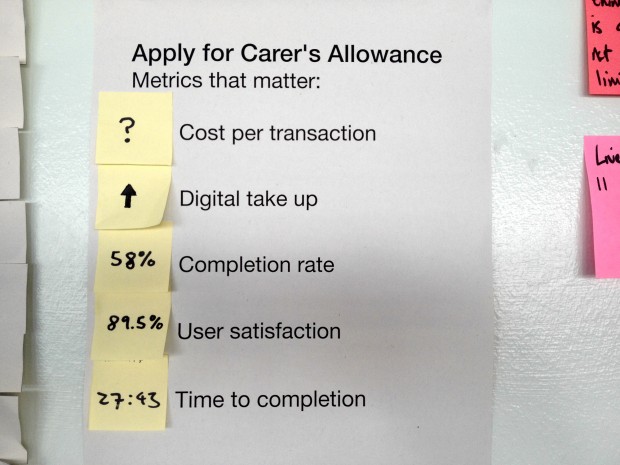
The key metrics for Carer’s Allowance are:
- Digital take up
- Time to completion
- User satisfaction
- Completion rates
You can see live data for our key metrics on the performance platform.
If we make a change to the service we can immediately see if the change impacted one or more of our key metrics.
For example, if user satisfaction drops by 10% we have immediate feedback and the team can respond. We can look back at the latest release to understand what happened, using research to help us understand why.
Here's an example
We’ve focussed a great deal on the key metric, time taken to complete a transaction.
By spending time talking to people about the service, we observed the following user need:
As a carer I need it to be quick and straightforward to make an application for Carer’s Allowance because my time is limited.
We know from user research that if someone is with the person they care for, a transaction longer than 20-30 minutes can be difficult to complete.
We’ve been making regular changes to the service to improve average time to completion. For example, reducing the steps needed to navigate through the transaction and removing questions that we didn’t need to ask.
As a result, average completion times have reduced from 35 to around 27 minutes in the last 9 months.
We know that there’s still room for improvement.
You can’t measure everything
It great to be able to measure changes we’ve made to the live service, but I’ve realised that you can’t measure everything in this way.
When you’re developing a product or service to meet user needs, not all changes will be directly attributable to key metrics. Some changes we make to a service are more subtle and therefore harder to measure, or require more user research to understand.
Keep in touch. Sign up to email updates from this blog. Follow Ben on Twitter.
6 comments
Comment by Dominic Hurst posted on
Great post Ben. "Agile metrics". I always try to measure everything (within reason) but focus on what matters. Most dashboards produced focus on organisation objectives and goals, but in the agile design process the "metrics that matter" focus on the issue at hand/ hypothesis.
Comment by Ana Santos posted on
Hi Ben,
Really enjoyed reading your post.
With regards to your last paragraph about not being able to measure everything, what actions do you take as an alternative to ensure the un-measurable changes still have an impact?
Thanks.
Comment by Ben Holliday posted on
Thanks Ana.
The way we approach this is more user research. We make user research part of every sprint - for this project it’s every 2 weeks. We can observe if something we've changed makes the product more usable, clearer to understand etc.
Comment by Peter Jordan posted on
Hi Ben
I wanted to talk a bit more about the role of data analytics in an agile environment.
Even today, analysis has been confused or conflated with management information, and the team (or probably just the manager) has received a detailed report that's too long, too late and not focused on the user needs of the end users or of the team responsible for the service.
But analysis has a strong place in agile product teams, provided that the service has been instrumented according to the specific data needs the team is after in each sprint. Digital analytics will capture and report data on the full complement of users’ behaviour (the what), which can be explored with smaller groups in user research (the why).
The key metrics you highlight are only high level KPIs and, of course, they’re invaluable for monitoring the performance of the service. For a service to really understand how each change impacts user behaviour there's a wealth of analytics data that can be mined. For example:
• Give detailed quantitative data on the total number of users getting to a service/section/page
• Highlight specifically where users are dropping out in a journey/transaction funnel
• Provide information on where users are clicking on a page
• Segment the data in a host of different ways such as device types and anonymised user demographics
By focusing on the team’s user needs for data and measuring incremental changes, digital analysis can be a powerful tool for the development of a service and complement user research.
Comment by Ben Holliday posted on
Thanks Peter.
I totally agree detailed analysis has an important place in agile product teams. We’re fortunate to have good data analysts embedded in our team working alongside product managers, designers, and user researchers.
We spend time looking at all the areas you mention. As well as user research, these provide valuable insights to help inform how we can improve the service.
We’re focussing on outcomes - changes we think will help us meet user needs. As I explained in the post, we use key metrics to measure how the latest changes we’ve made to the service are performing. If a change doesn’t have the outcome we expect we can quickly plan what to do next.
In my experience we can usually define a hypothesis based on a key metric that allows us to measure the outcome of most changes. We do look beyond the very top level metrics. For example, we might look at changes in the completion rate for a particular section of the application.
When it comes to planning what to do next we’ll then use all of our data and user insight, having learned from the previous release.
Comment by Heather Bolton posted on
As an Outsider who has followed News for many decades I am often frustrated by the "omission" of monitoring the effect of Gov Legislation. It appears to work well perhaps for time, then becomes distorted or misused. Nothing appears to be reviewed and perhaps ammended or ceased?