From February to April, the Standards team at GDS ran a discovery into the service assessment process. The aim was to understand what was working well and what was not working well.
In this post I'll explain how I approached the discovery.
Be prepared for discomfort
Researching the assessment process was a challenging task. The users aren't strangers you meet once in a research session. They're your colleagues, inside and outside GDS. You and they will have to live with the consequences of the findings. And the user’s pain feels a lot more painful, because it is all around you.
Focus on what people do - not what they say
I focused my research on two service assessment experiences, observing the assessments and interviewing all the assessors and service team members. This gave me a 360° view of a specific event. I could see how people behaved in that specific moment in time, rather than just talking about assessment in general.
That 360° perspective allowed me to see how even the best intentions had the potential to turn into a negative experience. And that even the best prepared teams could struggle in an assessment.
I also shadowed a service team and assessors before, during and after assessment. The shadowing revealed the nitty gritty of what was happening. This is really helpful when you start to re-design because it forces you to think about what exactly you are going to change and why.
Never underestimate how much data you will generate
I did 24 interviews and generated 469 pages of transcript. That’s a lot of reading. And it’s a lot of stickies.
I audio taped the interviews and used a transcription service - it’s so worth it. With so many interviews, so much detail, and so little time, transcription made it achievable.
Even so it was a minimum of 3 weeks of analysis. Trawling through those transcripts with a highlighter. Transcribing quotes onto stickies. Sorting stickies into groupings. Working out what the fundamental problems are. Categorising and prioritising. Working out what it all means and how to communicate that.
Keep sticky colour coding simple
At the beginning of any analysis phase I think about my sticky colour coding.
In the past I’ve found that if I make a complicated schema at the outset (eg a colour for tools, goals, behaviours, etc), it can constrain my thinking or my ability to move stickies around.
So this time I just had one colour for big issues (pink), and a second colour for sub-issues (orange) that sat under a specific big issue. And then one colour for client organisations (green) and another for GDS (yellow).
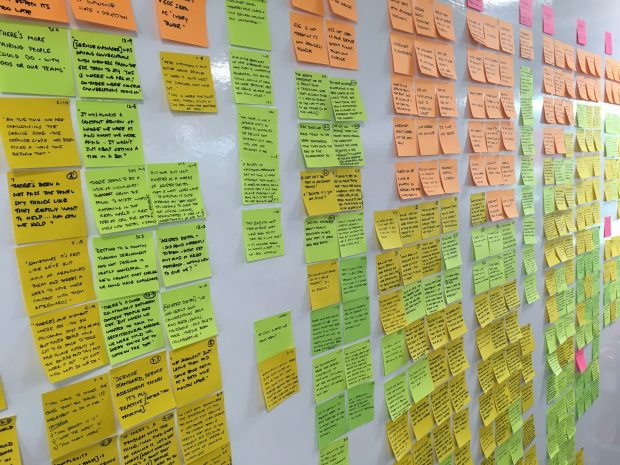
It’s important to make sure you have enough of each sticky colour at the beginning! Each quote sticky has the participant number on it so it could - if necessary - be tied back to the original transcript.
Boil it down. Boil it down. Boil it down.
I boiled it down to 10 slides. That’s not to say there were 10 slides worth of findings - I could write a big book of findings.
But if you have a 15 minute presentation slot, you need to boil it down into the most critical issues, and the most fundamental problems.
This is probably the hardest thing. As a researcher I love detail. I want to tell people everything. But holding people’s attention is more important than ramming them full of beautiful details.
Keep in touch. Sign up to email updates from this blog. Follow Sarah on Twitter.
Featured image by the author, Attribution-NonCommercial-NoDerivatives 4.0 International (CC BY-NC-ND 4.0)
2 comments
Comment by Mark Hulett posted on
Hi Sarah,
I'm interested in the findings. Will you share them in your next blog?
Comment by Sarah Herman posted on
A blog about the findings can be found here:
https://governmenttechnology.blog.gov.uk/2016/06/21/digital-service-standard-assessments-discovery/