The Government as a Platform (GaaP) programme recently ran a discovery to work out what components to look at next. To do this, we interviewed 150 randomly-selected services across government.
We spoke to the people who run the services day-in and day-out. We asked about their service, their users, their team and how these things worked together.
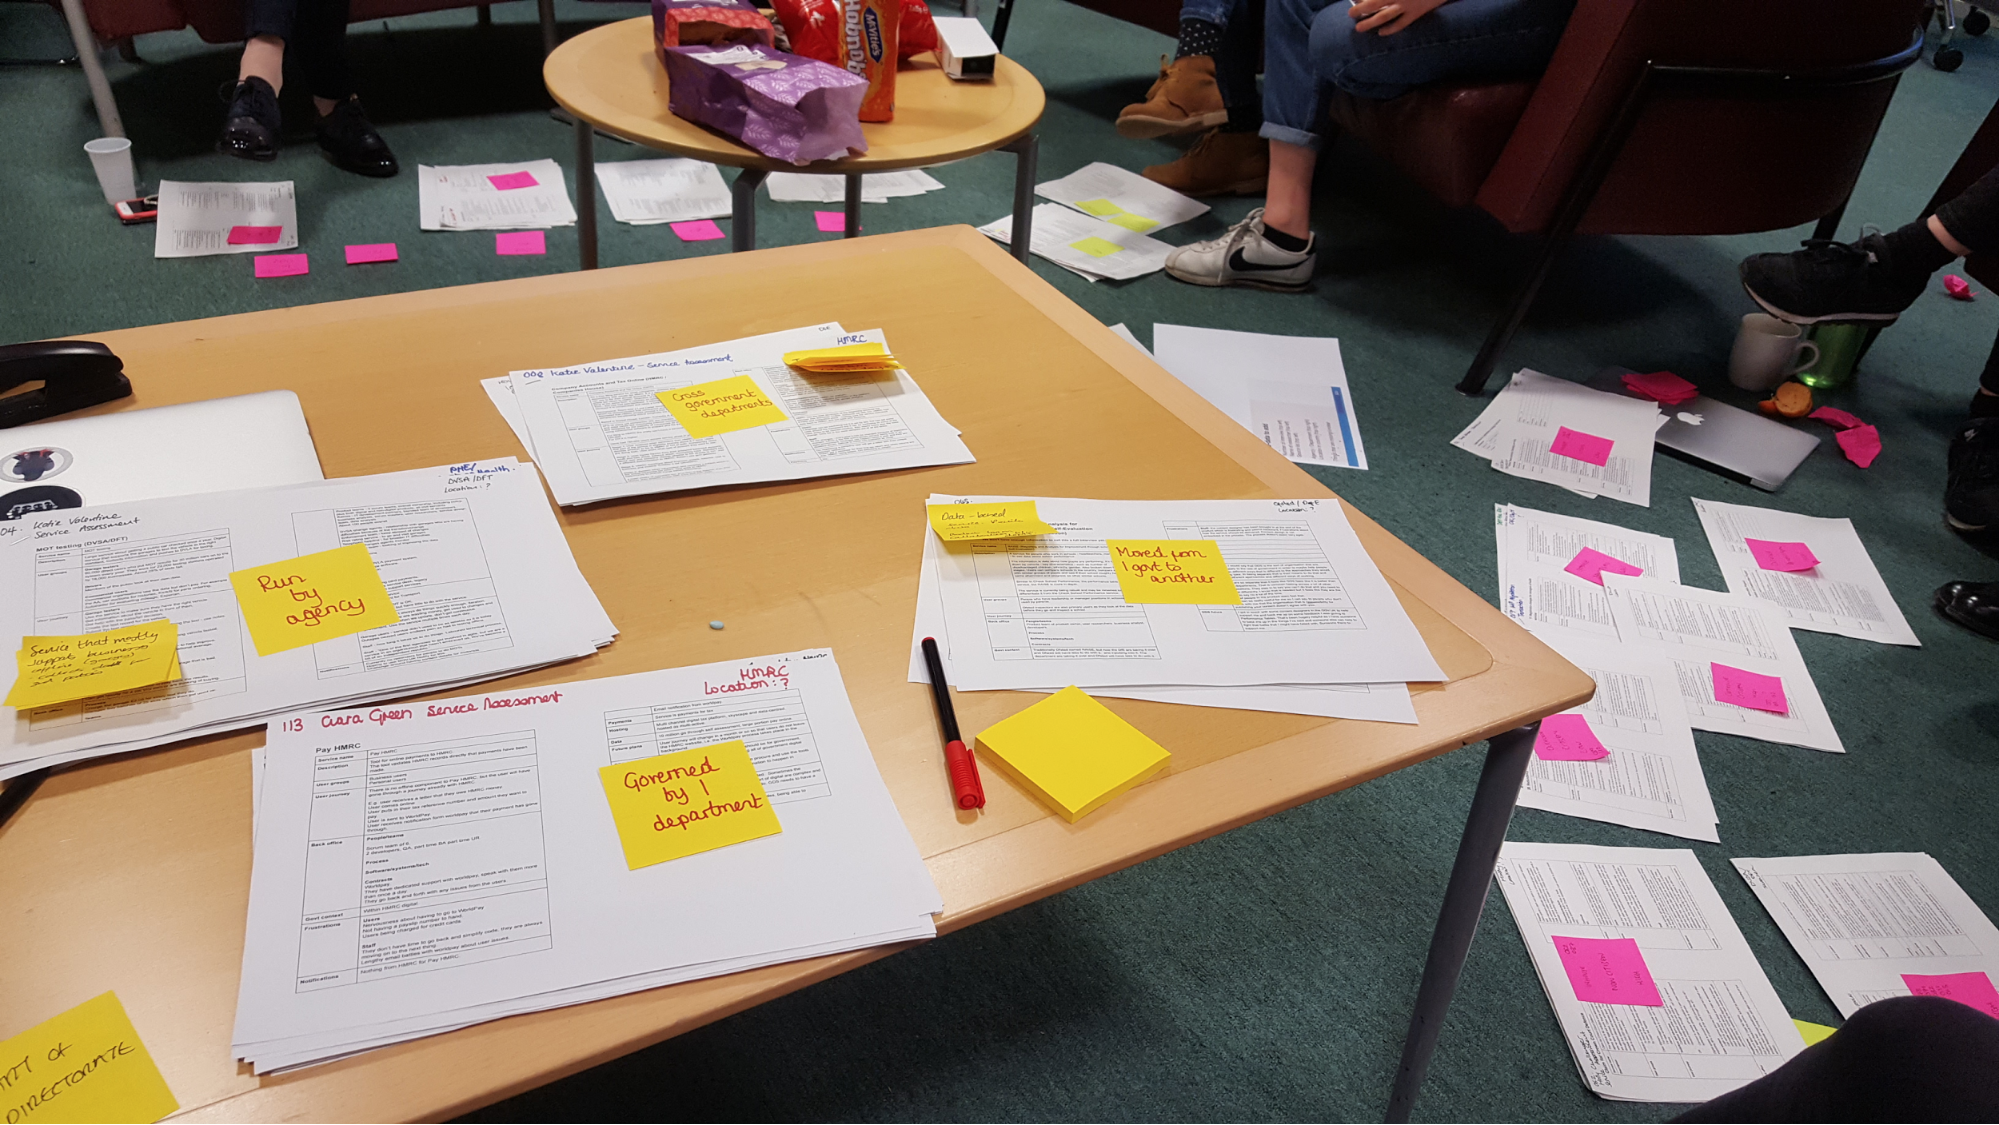
In this post, I’m going to explain how we held one of our group analysis sessions to break down the results we received from this large-scale piece of work.
Why we went for group sessions
We held 4 separate 3-hour sessions, with 12 colleagues in each session. The participants included product managers, service designers and various stakeholders of the Government as a Platform programme. We followed the standard guidelines for analysis as laid out in the Service Manual, adapted in a way that worked for the large amount of data we were looking at.
Holding group analysis sessions was the most efficient way for us to get useful findings from the large amount of data we collected. The analysis sessions also acted as one of the main ways we engaged stakeholders from around GDS in what we found.
What we used:
- printouts of interview transcripts
- highlighters
- Post-its
- slide deck of instructions (see below)
- a screen to play our slide deck
- wall space
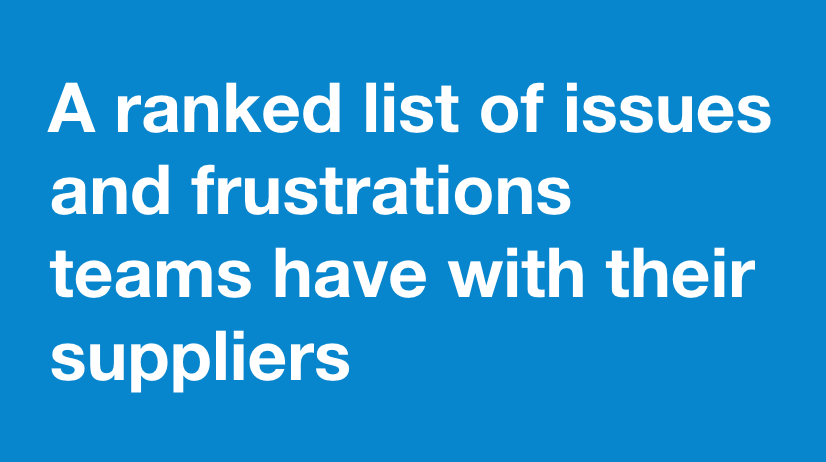
We started the workshop by making it clear what we wanted to end up with. For us it was, ‘a ranked list of issues and frustrations teams have with their suppliers’.
We then explained how the session would be split into parts to reach this goal.
Part 1 - highlighting
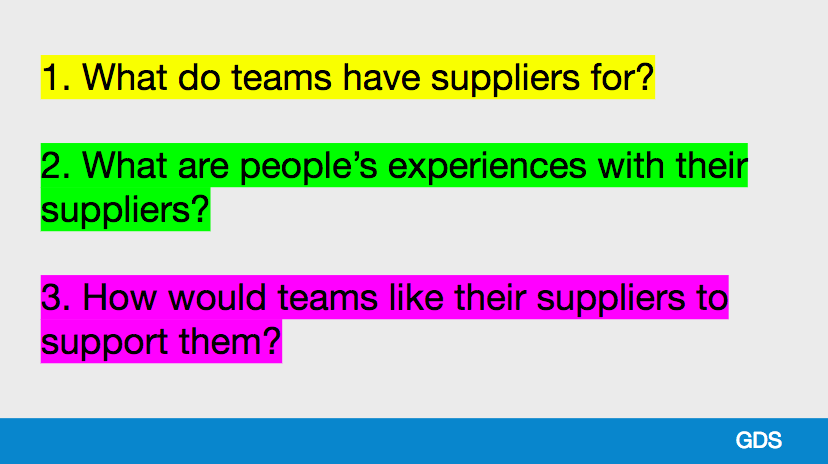
Our participants split into groups of 3 and each had a set of highlighters - yellow, pink, green. Everyone had one highlighter and one corresponding question to focus on.
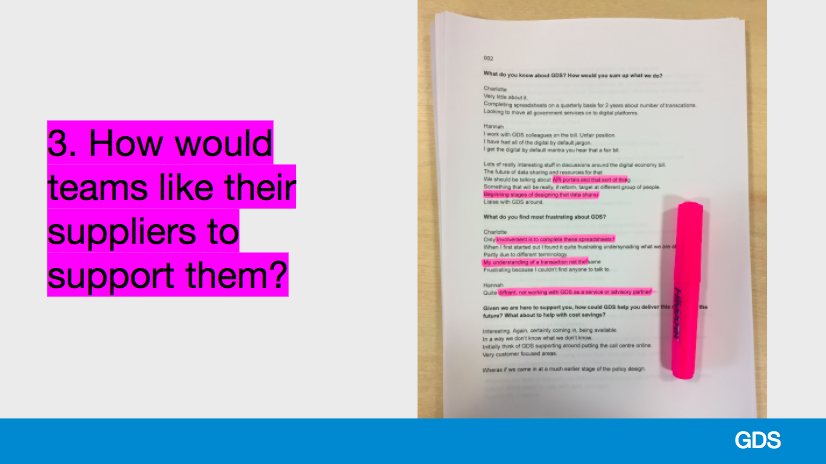
Each participant individually highlighted parts of the transcript/summary that related to their question. To make this task really clear, I showed a photographed example on the slides of what each individual needed to do for their question.
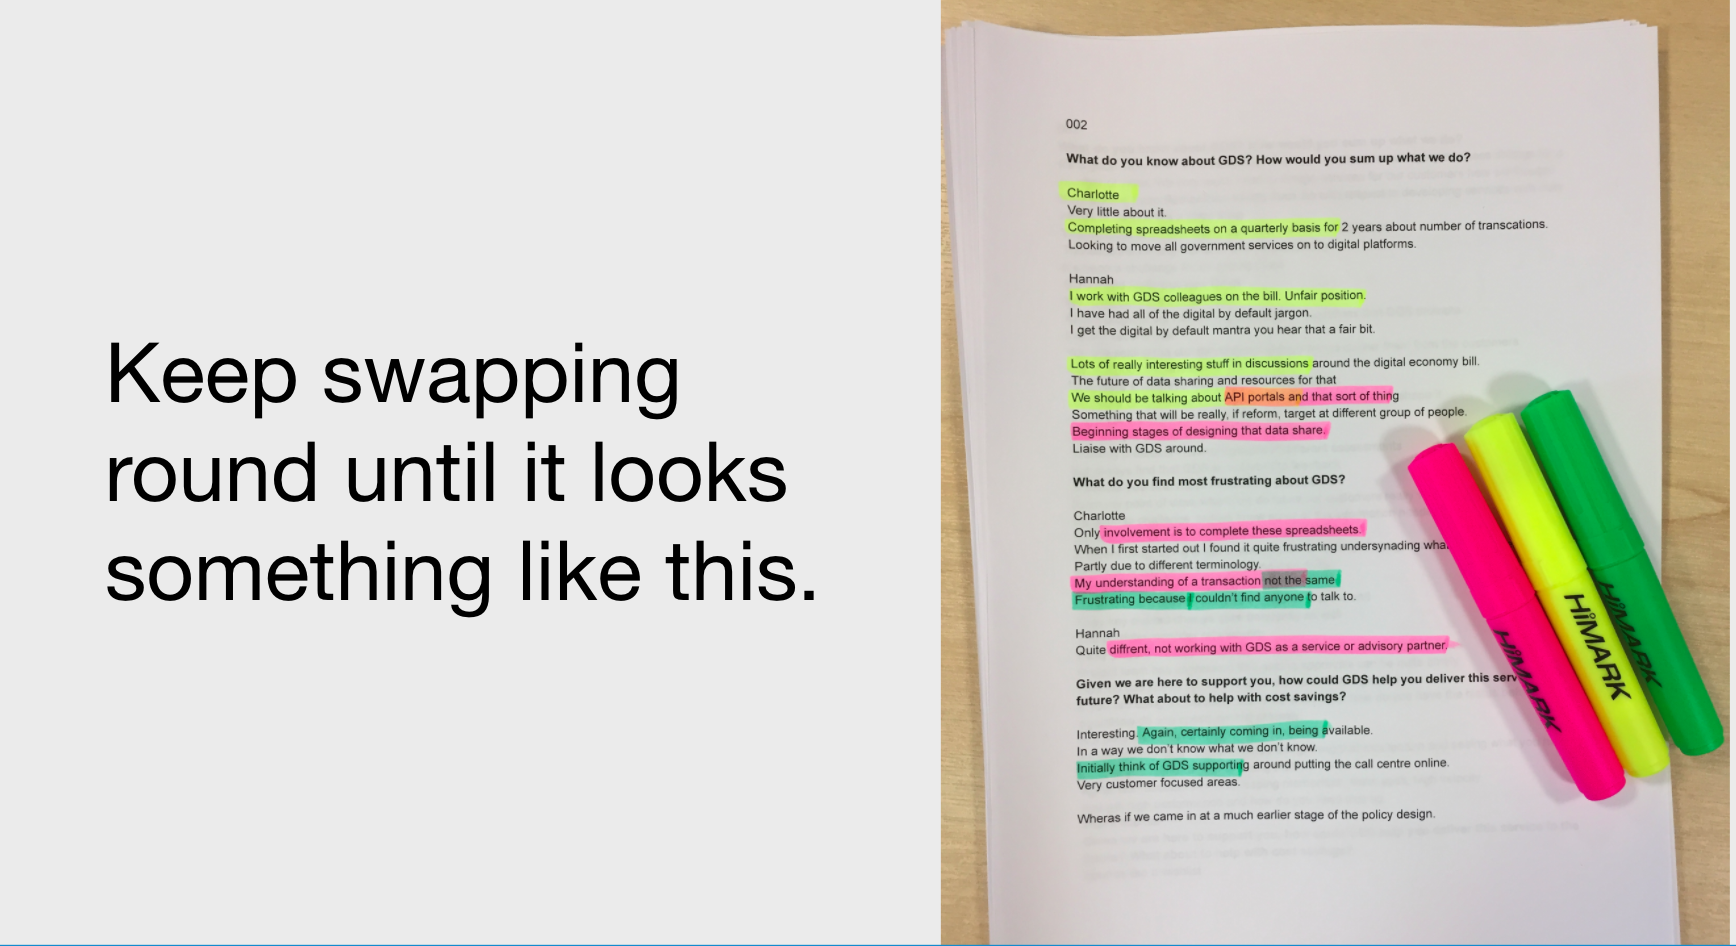
Participants swapped around notes in their group until they had covered all of the research questions. Another photo example on the slide to show what each group should end up with was really helpful at this point.
Useful tip: Leave instructions on a presentation screen for people to refer to, and give a printout of the highlighted research questions to each group. Then people can remind themselves what their question is, while also being able to refer back to the instructions if they need them.
Part 2 - picking out the most important points
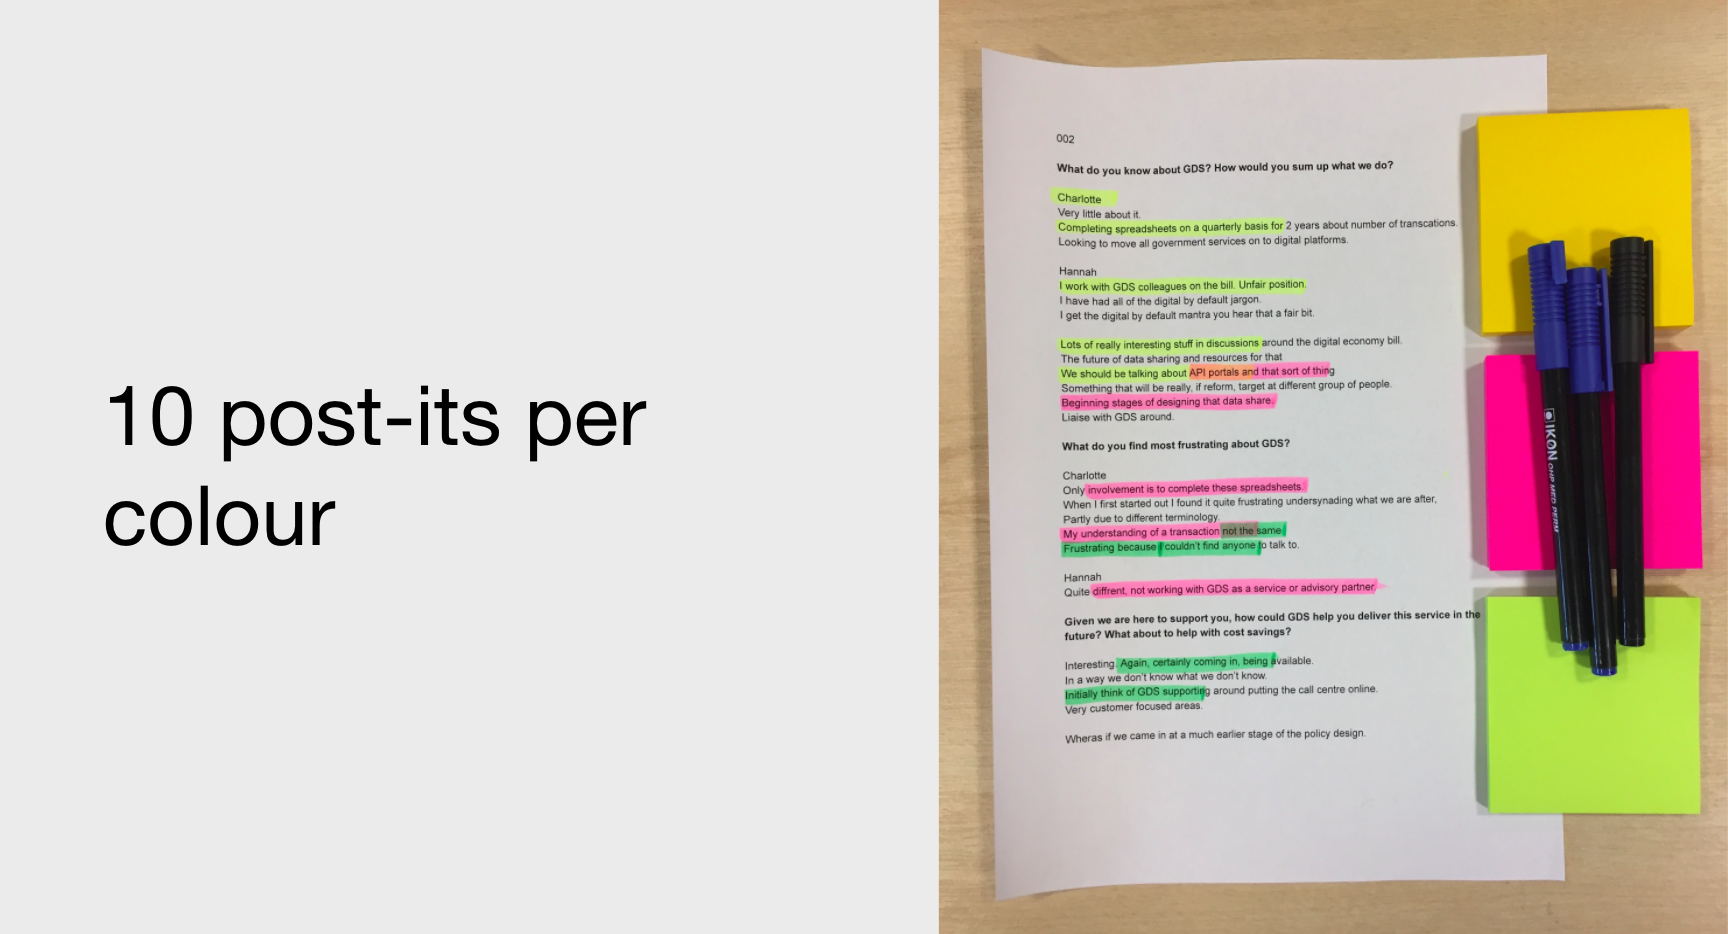
Participants then extracted 10 Post-its of what they saw as the most important highlights that relate to each research question/colour, with each group ending up with around 30 Post-its in total.
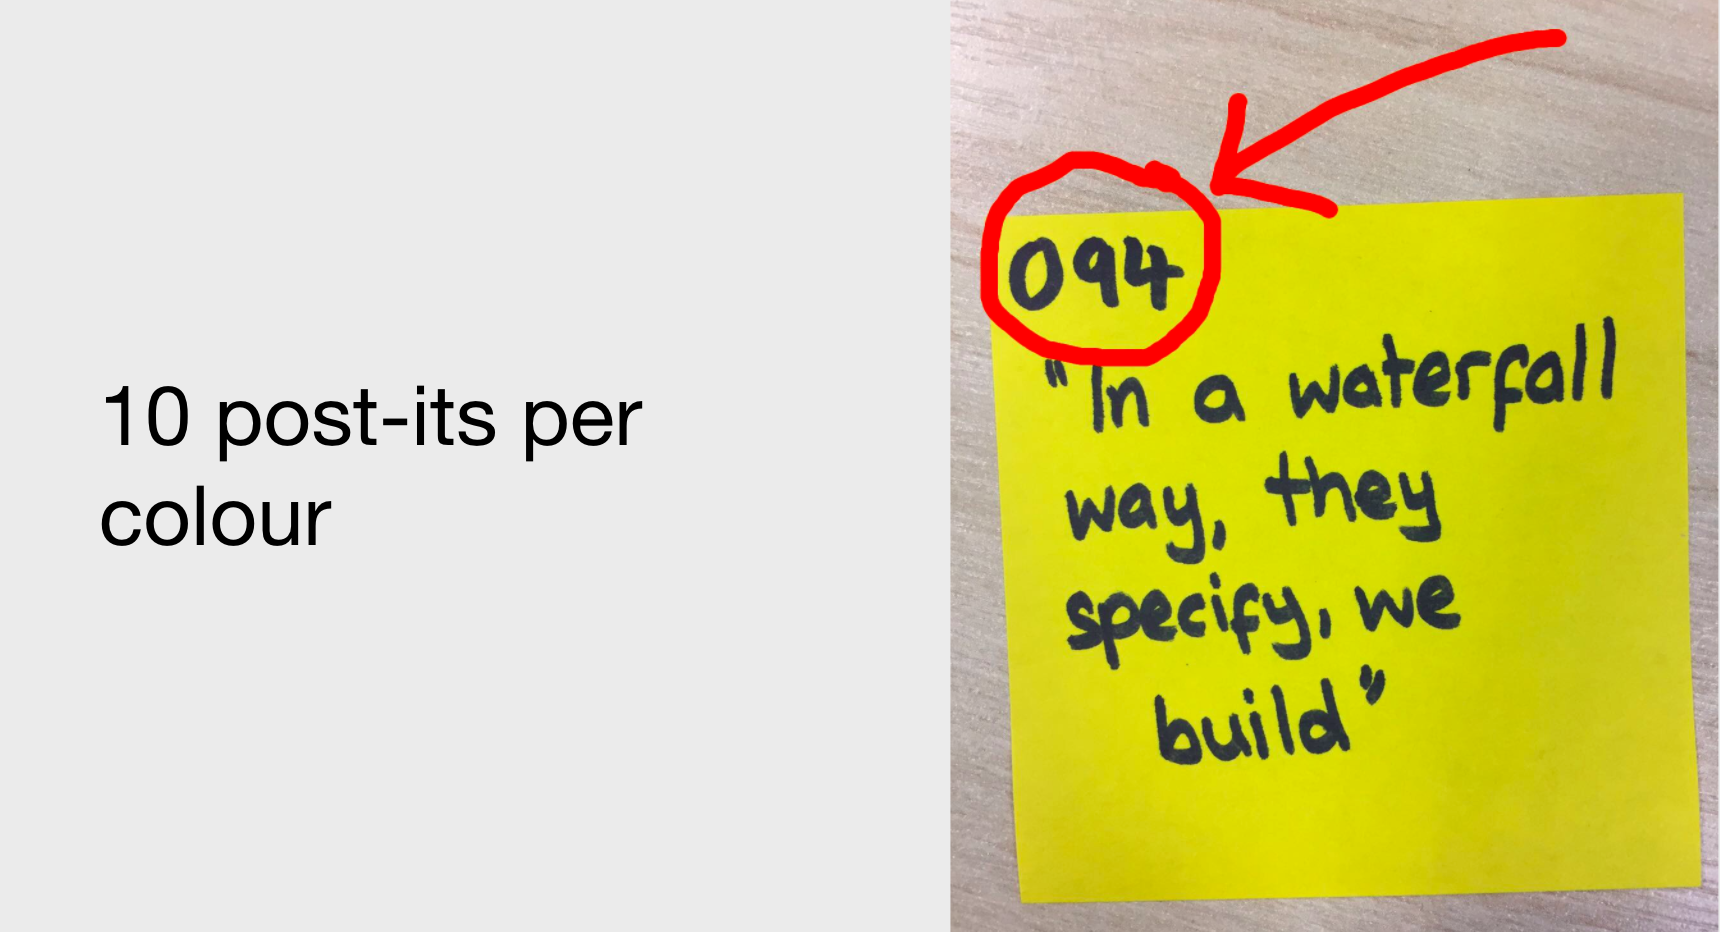
Before starting this, I gave clear instructions on what a Post-it should look like. I was pleased to have a good amount of non-user researchers taking part in the analysis session, and I understood that this wouldn’t be second nature to everyone.
Part 3 - clustering and prioritising
The groups merged so that the 4 groups of 3 became 2 groups of 6. I made sure there was one experienced user researcher in each group to help the upcoming clustering exercise go smoothly.
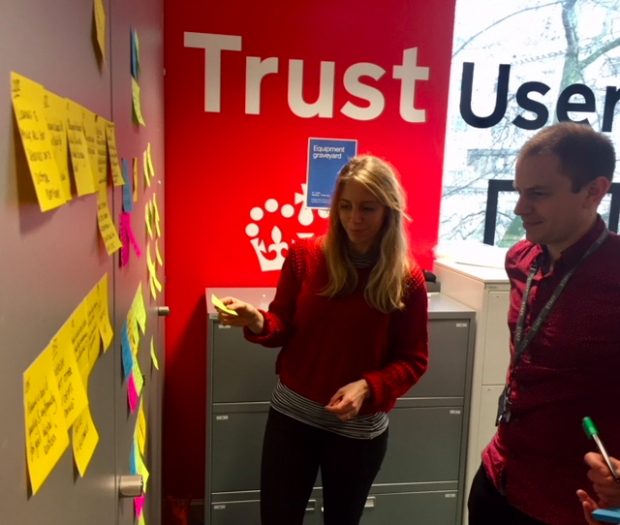
The 2 groups clustered Post-its by theme. At this point they put aside the research questions and the Post-it colours, and clustered the Post-its based on the similarities of their contents. They labeled the clusters with statements, not nouns, and put these statements on a new set of coloured Post-its. Ultimately, I wanted each group to end up with between 6 and 10 findings statements.
I then asked the teams to prioritise the statements based on their importance. By doing this, we reached the objective that I highlighted at the beginning of the session: a ranked list of issues and frustrations teams have with their suppliers.
Each group then presented back their prioritised list to the other, which was ample opportunity for questions and discussion.
How does your team tackle big sets of data?
Using this method could help you involve your team in understanding your users when there are large amounts of data involved.
What methods have you used to help your team members get to know large amounts of data? Let us know in the comments section.
Follow Ciara on Twitter and don't forget to sign up for email alerts.
2 comments
Comment by Simon Johnson posted on
At BEIS we move our post-its to Airtable. It made sharing easier and when the post-it's start falling off the wall we still had a record of the findings.
Comment by Chris Adams posted on
Hi Ciara, thanks for sharing this. Roughly how many interview transcripts did the participants process in this way in the end?
I can follow that you ended with two groups of between 6 and 10 ranked issues team have with their supplier, and I can follow that 150 different services were interviewed, but I wasn't clear on how many interview transcripts were typically generated when interviewing each service.
Thanks again for sharing this - it's really useful and interesting to see how it's done.